Description
This Power BI dashboard template is designed specifically for QS professionals, planning engineers, and cost control managers who want to visualize project data dynamically.
🎯 Key Features:
-
🔧 Connects with Excel BOQ & Cost Sheets
-
📅 Visualizes Monthly Cost, Cumulative Progress & Earned Value
-
📉 S-Curve Generation for Progress and Cash Flow
-
🧠 KPIs: Planned vs Actual, Productivity, Variations, Payments
-
🖱️ Easy to filter by WBS, Contractor, Activity Type
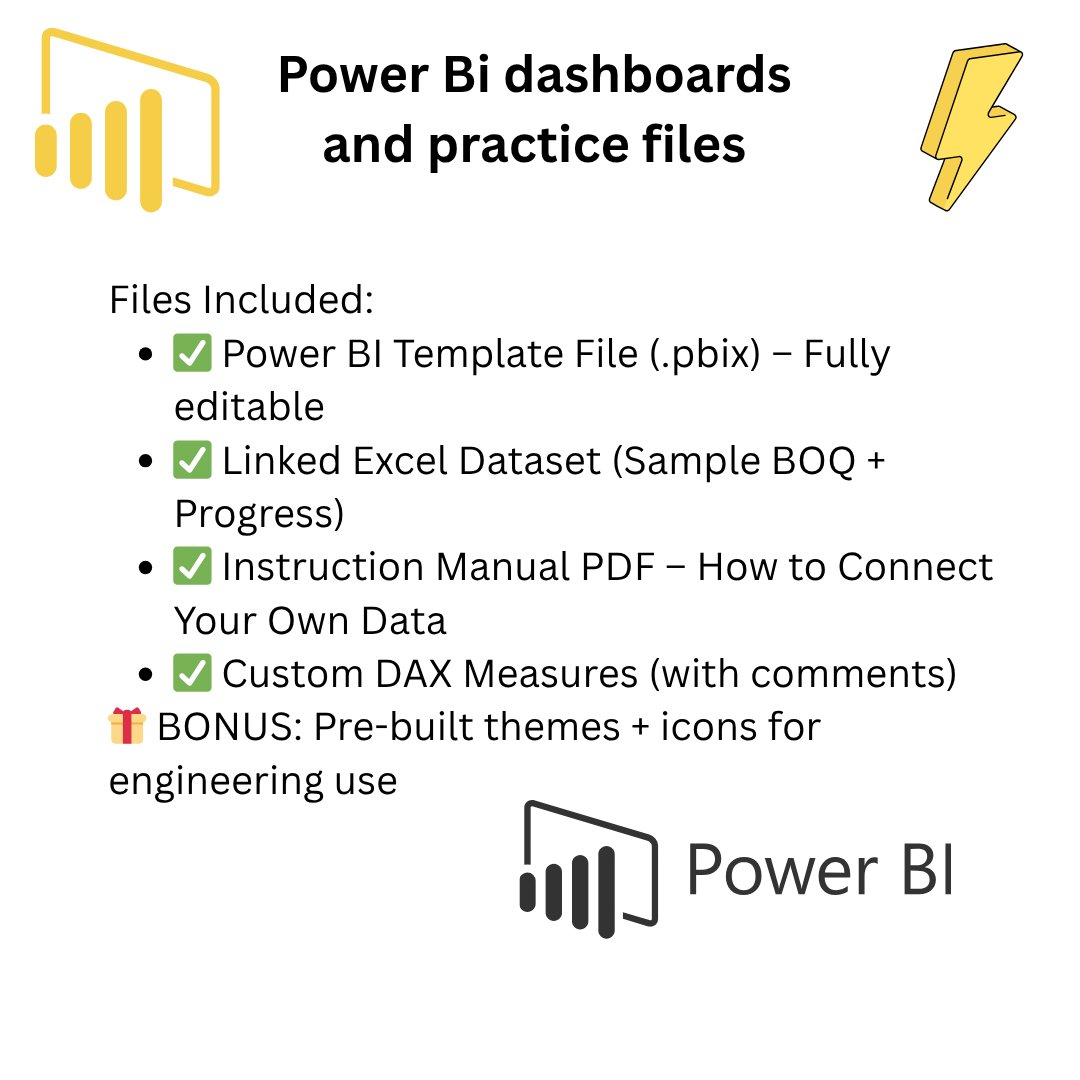
📦 Files Included:
-
✅ Power BI Template File (.pbix) – Fully editable
-
✅ Linked Excel Dataset (Sample BOQ + Progress)
-
✅ Instruction Manual PDF – How to Connect Your Own Data
-
✅ Custom DAX Measures (with comments)
🎁 BONUS: Pre-built themes + icons for engineering use
💡 Ideal For:
-
Planning & Cost Engineers
-
Freelancers offering reports to clients
-
Civil QS managing multiple projects
-
Job seekers creating a portfolio
⚙️ Requirements:
-
Microsoft Power BI Desktop (Free Version)
-
Basic knowledge of Excel structure


Reviews
There are no reviews yet.